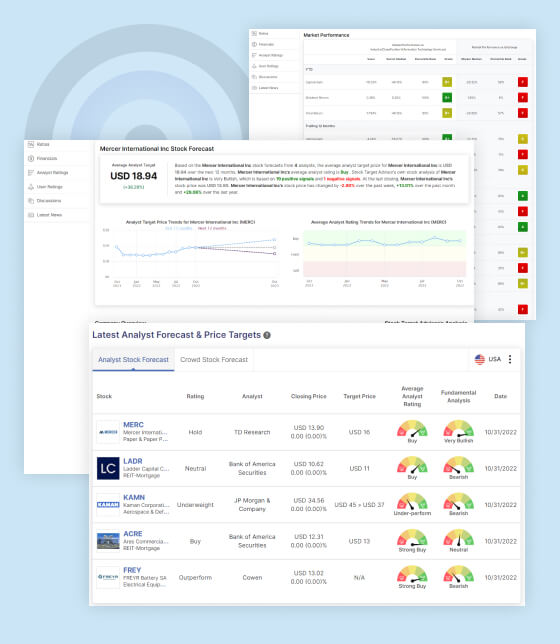
Based on the Arvinas Inc stock forecast from 9 analysts, the average analyst target price for Arvinas Inc is USD 48.07 over the next 12 months. Arvinas Inc’s average analyst rating is Strong Buy. Stock Target Advisor’s own stock analysis of Arvinas Inc is Neutral, which is based on 5 positive signals and 5 negative signals. At the last closing, Arvinas Inc’s stock price was USD 20.92. Arvinas Inc’s stock price has changed by +39.56% over the past week, +27.10% over the past month and -60.55% over the last year.
No recent analyst target price found for Arvinas Inc
No recent average analyst rating found for Arvinas Inc
Company Overview Arvinas Inc
Arvinas, Inc., a clinical-stage biotechnology company, engages in the discovery, development, and commercialization of therapies to degrade disease-causing proteins. The company engineers proteolysis targeting chimeras (PROTAC) targeted protein degraders that are designed to harness the body's own natural protein disposal system to degrade and remove disease-causing proteins. Its product pipeline includes Bavdegalutamide and ARV-766, investigational orally bioavailable PROTAC protein degraders for the treatment of men with metastatic castration-resistant prostate cancer, which are in Phase 1/2 clinical trials; and ARV-471, an orally bioavailable estrogen receptor degrading PROTAC targeted protein degrader for the treatment of patients with locally advanced or metastatic estrogen receptor+/human epidermal growth factor receptor 2-breast cancer, which is Phase 3 clinical trial. The company has collaborations with Pfizer Inc., Genentech, Inc., F. Hoffman-La Roche Ltd., Carrick Therapeutics Limited, and Bayer AG. Arvinas, Inc. was founded in 2013 and is based in New Haven, Connecticut. Address: 5 Science Park, New Haven, CT, United States, 06511 Read Less
Arvinas, Inc., a clinical-stage biotechnology company, engages in the discovery, development, and commercialization of therapies to degrade disease-causing proteins. The company engineers proteolysis targeting chimeras (PROTAC) targeted protein degraders that are designed to harn...Read More
Frequently Asked Questions About Arvinas Inc (ARVN) Stock
Based on ratings from 9 analysts Arvinas Inc's stock is Strong Buy. Stock Target Advisor's fundamental analysis is Neutral. The stock has 9 buy, sell and 3 hold ratings.
Unfortunately we do not have enough data on ARVN's stock to indicate if its a good dividend stock.
Based on targets from 9 analysts, the average taret price for ARVN is USD 48.07 over the next 12 months. The maximum analyst target price is USD 95 while the minimum anlayst target price is USD 20.
ARVN stock's Price/Earning ratio is 0.90.
Our analysis grades ARVN stock's Price / Earning ratio at D+. This means that ARVN stock's Price/Earning ratio is above 31.00000000000001% of the stocks in the Biotechnology sector in the NSD exchange.
Based on this ARVN may be fairly valued for its sector
The last closing price of ARVN's stock was USD 20.92.
The most recent market capitalization for ARVN is USD 1.12B.
Based on targets from 9 analysts, the average taret price for ARVN is projected at USD 48.07 over the next 12 months.
This means that ARVN's stock price may go up by +129.79% over the next 12 months.
Heading 1
Heading 2
Heading 3
Heading 4
Heading 5
Data 1
Data 2
Data 3
Data 4
Data 5
Data 1
Data 2
Data 3
Data 4
Data 5
Data 1
Data 2
Data 3
Data 4
Data 5
Data 1
Data 2
Data 3
Data 4
Data 5
Data 1
Data 2
Data 3
Data 4
Data 5
Data 1
Data 2
Data 3
Data 4
Data 5
Data 1
Data 2
Data 3
Data 4
Data 5
Data 1
Data 2
Data 3
Data 4
Data 5
Data 1
Data 2
Data 3
Data 4
Data 5
Data 1
Data 2
Data 3
Data 4
Data 5
Data 1
Data 2
Data 3
Data 4
Data 5
Data 1
Data 2
Data 3
Data 4
Data 5
Data 1
Data 2
Data 3
Data 4
Data 5
Data 1
Data 2
Data 3
Data 4
Data 5
Data 1
Data 2
Data 3
Data 4
Data 5
Data 1
Data 2
Data 3
Data 4
Data 5
Data 1
Data 2
Data 3
Data 4
Data 5
Data 1
Data 2
Data 3
Data 4
Data 5
Data 1
Data 2
Data 3
Data 4
Data 5
Data 1
Data 2
Data 3
Data 4
Data 5
Data 1
Data 2
Data 3
Data 4
Data 5
Data 1
Data 2
Data 3
Data 4
Data 5
Data 1
Data 2
Data 3
Data 4
Data 5
Data 1
Data 2
Data 3
Data 4
Data 5
Data 1
Data 2
Data 3
Data 4
Data 5
Data 1
Data 2
Data 3
Data 4
Data 5
Data 1
Data 2
Data 3
Data 4
Data 5
Data 1
Data 2
Data 3
Data 4
Data 5
Data 1
Data 2
Data 3
Data 4
Data 5
Data 1
Data 2
Data 3
Data 4
Data 5
Data 1
Data 2
Data 3
Data 4
Data 5
Data 1
Data 2
Data 3
Data 4
Data 5
Data 1
Data 2
Data 3
Data 4
Data 5
Data 1
Data 2
Data 3
Data 4
Data 5
Data 1
Data 2
Data 3
Data 4
Data 5
Data 1
Data 2
Data 3
Data 4
Data 5
Data 1
Data 2
Data 3
Data 4
Data 5
Data 1
Data 2
Data 3
Data 4
Data 5
Data 1
Data 2
Data 3
Data 4
Data 5
Data 1
Data 2
Data 3
Data 4
Data 5
Data 1
Data 2
Data 3
Data 4
Data 5
Data 1
Data 2
Data 3
Data 4
Data 5
Data 1
Data 2
Data 3
Data 4
Data 5
Data 1
Data 2
Data 3
Data 4
Data 5
Data 1
Data 2
Data 3
Data 4
Data 5
Data 1
Data 2
Data 3
Data 4
Data 5
Data 1
Data 2
Data 3
Data 4
Data 5
Data 1
Data 2
Data 3
Data 4
Data 5
Data 1
Data 2
Data 3
Data 4
Data 5
Data 1
Data 2
Data 3
Data 4
Data 5
Stock Target Advisor's Analysis
This is a composite scorecard based on the application of evaluation criteria deemed most important by analysts. This is not a buy or sell recommendation.
What to like
Low debt
The company is less leveraged than its peers ,, and is among the top quartile, which makes it more flexible. However, do check the news and look at its sector. Sometimes this is low because the company is not growing and has no growth potential.
Superior risk adjusted returns
This stock has performed well, on a risk adjusted basis, compared to its sector peers(for a hold period of at least 12 months) and is in the top quartile.
Superior return on assets
The company management has delivered better return on assets in the most recent 4 quarters than its peers, placing it in the top quartile.
High market capitalization
This is one of the largest entities in its sector and is among the top quartile. Such companies tend to be more stable.
Superior Revenue Growth
This stock has shown top quartile revenue growth in the previous 5 years compared to its sector.
What not to like
Overpriced compared to book value
The stock is trading high compared to its peers median on a price to book value basis.
High volatility
The total returns for this company are volatile and above median for its sector over the past 5 years. Make sure you have the risk tolerance for investing in such stock.
Negative cashflow
The company had negative total cash flow in the most recent four quarters.
Negative free cash flow
The company had negative total free cash flow in the most recent four quarters.
Low Earnings Growth
This stock has shown below median earnings growth in the previous 5 years compared to its sector
Add to Watchlists
loading..
Thank you for Sharing your Stock Targets for ARVN !
Loading...
Please login to proceed
Sorry - extended search is only available for registered users.