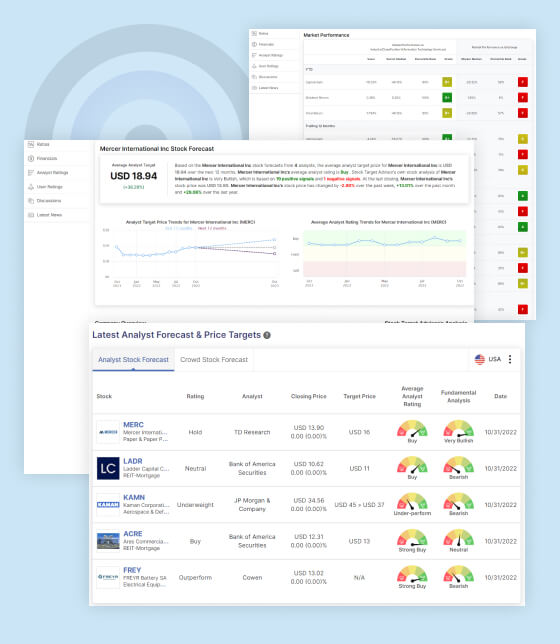
Based on the Broadcom Inc stock forecast from 17 analysts, the average analyst target price for Broadcom Inc is USD 919.47 over the next 12 months. Broadcom Inc’s average analyst rating is Strong Buy. Stock Target Advisor’s own stock analysis of Broadcom Inc is Bullish , which is based on 12 positive signals and 5 negative signals. At the last closing, Broadcom Inc’s stock price was USD 977.73. Broadcom Inc’s stock price has changed by +2.11% over the past week, +10.55% over the past month and +90.92% over the last year.
No recent analyst target price found for Broadcom Inc
No recent average analyst rating found for Broadcom Inc
Company Overview Broadcom Inc
Broadcom Inc. designs, develops, and supplies various semiconductor devices with a focus on complex digital and mixed signal complementary metal oxide semiconductor based devices and analog III-V based products worldwide. The company operates in two segments, Semiconductor Solutions and Infrastructure Software. It provides set-top box system-on-chips (SoCs); cable, digital subscriber line, and passive optical networking central office/consumer premise equipment SoCs; wireless local area network access point SoCs; Ethernet switching and routing custom silicon solutions; embedded processors and controllers; serializer/deserializer application specific integrated circuits; optical and copper, and physical layer devices; and fiber optic components and RF semiconductor devices. The company also offers RF front end modules and filter; Wi-Fi, Bluetooth, and global positioning system/global navigation satellite system SoCs; custom touch controllers; custom touch controllers; inductive charging; attached small computer system interface, and redundant array of independent disks controllers and adapters; peripheral component interconnect express; fiber channel host bus adapters; read channel based SoCs; custom flash controllers; preamplifiers; optocouplers, industrial fiber optics, and motion control encoders and subsystems; light emitting diode, ethernet PHYs, switch ICs, and camera microcontrollers. Its products are used in various applications, including enterprise and data center networking, home connectivity, set-top boxes, broadband access, telecommunication equipment, smartphones and base stations, data center servers and storage systems, factory automation, power generation and alternative energy systems, and electronic displays. Broadcom Inc. was incorporated in 2018 and is headquartered in San Jose, California. Address: 1320 Ridder Park Drive, San Jose, CA, United States, 95131-2313 Read Less
Broadcom Inc. designs, develops, and supplies various semiconductor devices with a focus on complex digital and mixed signal complementary metal oxide semiconductor based devices and analog III-V based products worldwide. The company operates in two segments, Semiconductor Soluti...Read More
Frequently Asked Questions About Broadcom Inc (AVGO) Stock
Based on ratings from 17 analysts Broadcom Inc's stock is Strong Buy. Stock Target Advisor's fundamental analysis is Bullish . The stock has 27 buy, sell and 4 hold ratings.
AVGO stock's dividend yield is 1.89%.
Our analysis grades AVGO stock's dividend yield at F. This means that AVGO stock's dividend yield is above 41% of the stocks in the Semiconductors sector in the NSD exchange.
Based on this AVGO may be a average dividend stock for its sector.
Based on targets from 17 analysts, the average taret price for AVGO is USD 919.47 over the next 12 months. The maximum analyst target price is USD 1050 while the minimum anlayst target price is USD 785.
AVGO stock's Price/Earning ratio is 29.98.
Our analysis grades AVGO stock's Price / Earning ratio at F. This means that AVGO stock's Price/Earning ratio is above 62% of the stocks in the Semiconductors sector in the NSD exchange.
Based on this AVGO may be a overvalued for its sector.
The last closing price of AVGO's stock was USD 977.73.
The most recent market capitalization for AVGO is USD 402.58B.
Based on targets from 17 analysts, the average taret price for AVGO is projected at USD 919.47 over the next 12 months.
This means that AVGO's stock price may go down by -5.96% over the next 12 months.
Heading 1
Heading 2
Heading 3
Heading 4
Heading 5
Data 1
Data 2
Data 3
Data 4
Data 5
Data 1
Data 2
Data 3
Data 4
Data 5
Data 1
Data 2
Data 3
Data 4
Data 5
Data 1
Data 2
Data 3
Data 4
Data 5
Data 1
Data 2
Data 3
Data 4
Data 5
Data 1
Data 2
Data 3
Data 4
Data 5
Data 1
Data 2
Data 3
Data 4
Data 5
Data 1
Data 2
Data 3
Data 4
Data 5
Data 1
Data 2
Data 3
Data 4
Data 5
Data 1
Data 2
Data 3
Data 4
Data 5
Data 1
Data 2
Data 3
Data 4
Data 5
Data 1
Data 2
Data 3
Data 4
Data 5
Data 1
Data 2
Data 3
Data 4
Data 5
Data 1
Data 2
Data 3
Data 4
Data 5
Data 1
Data 2
Data 3
Data 4
Data 5
Data 1
Data 2
Data 3
Data 4
Data 5
Data 1
Data 2
Data 3
Data 4
Data 5
Data 1
Data 2
Data 3
Data 4
Data 5
Data 1
Data 2
Data 3
Data 4
Data 5
Data 1
Data 2
Data 3
Data 4
Data 5
Data 1
Data 2
Data 3
Data 4
Data 5
Data 1
Data 2
Data 3
Data 4
Data 5
Data 1
Data 2
Data 3
Data 4
Data 5
Data 1
Data 2
Data 3
Data 4
Data 5
Data 1
Data 2
Data 3
Data 4
Data 5
Data 1
Data 2
Data 3
Data 4
Data 5
Data 1
Data 2
Data 3
Data 4
Data 5
Data 1
Data 2
Data 3
Data 4
Data 5
Data 1
Data 2
Data 3
Data 4
Data 5
Data 1
Data 2
Data 3
Data 4
Data 5
Data 1
Data 2
Data 3
Data 4
Data 5
Data 1
Data 2
Data 3
Data 4
Data 5
Data 1
Data 2
Data 3
Data 4
Data 5
Data 1
Data 2
Data 3
Data 4
Data 5
Data 1
Data 2
Data 3
Data 4
Data 5
Data 1
Data 2
Data 3
Data 4
Data 5
Data 1
Data 2
Data 3
Data 4
Data 5
Data 1
Data 2
Data 3
Data 4
Data 5
Data 1
Data 2
Data 3
Data 4
Data 5
Data 1
Data 2
Data 3
Data 4
Data 5
Data 1
Data 2
Data 3
Data 4
Data 5
Data 1
Data 2
Data 3
Data 4
Data 5
Data 1
Data 2
Data 3
Data 4
Data 5
Data 1
Data 2
Data 3
Data 4
Data 5
Data 1
Data 2
Data 3
Data 4
Data 5
Data 1
Data 2
Data 3
Data 4
Data 5
Data 1
Data 2
Data 3
Data 4
Data 5
Data 1
Data 2
Data 3
Data 4
Data 5
Data 1
Data 2
Data 3
Data 4
Data 5
Data 1
Data 2
Data 3
Data 4
Data 5
Stock Target Advisor's Analysis
This is a composite scorecard based on the application of evaluation criteria deemed most important by analysts. This is not a buy or sell recommendation.
What to like
Low volatility
The stock’s annual returns have been stable and consistent compared to its sector peers(for a hold period of at least 12 months) and is in the top quartile. Although stability is good, also keep in mind it can limit returns.
Superior risk adjusted returns
This stock has performed well, on a risk adjusted basis, compared to its sector peers(for a hold period of at least 12 months) and is in the top quartile.
Positive cash flow
The company had positive total cash flow in the most recent four quarters.
Positive free cash flow
The company had positive total free cash flow in the most recent four quarters.
Superior return on assets
The company management has delivered better return on assets in the most recent 4 quarters than its peers, placing it in the top quartile.
Superior total returns
The stock has outperformed its sector peers on average annual total returns basis in the past 5 years (for a hold period of at least 12 months) and is in the top quartile.
High market capitalization
This is one of the largest entities in its sector and is among the top quartile. Such companies tend to be more stable.
Superior Revenue Growth
This stock has shown top quartile revenue growth in the previous 5 years compared to its sector.
Superior Earnings Growth
This stock has shown top quartile earnings growth in the previous 5 years compared to its sector.
Superior Dividend Growth
This stock has shown top quartile dividend growth in the previous 5 years compared to its sector
High dividend returns
The stock has outperformed its sector peers on average annual dividend returns basis in the past 5 years (for a hold period of at least 12 months) and is in the top quartile. This can be a good buy, especially if it is outperforming on total return basis , for investors seeking high income yields.
Superior return on equity
The company management has delivered better return on equity in the most recent 4 quarters than its peers, placing it in the top quartile.
What not to like
Overpriced compared to book value
The stock is trading high compared to its peers median on a price to book value basis.
Overpriced compared to earnings
The stock is trading high compared to its peers on a price to earning basis and is above the sector median.
Overpriced on cashflow basis
The stock is trading high compared to its peers on a price to cash flow basis. It is priced above the median for its sectors. Proceed with caution if you are considering to buy.
Highly leveraged
The company is in the bottom half compared to its sector peers on debt to equity and is highly leveraged. However, do check the news and look at its sector and management statements. Sometimes this is high because the company is trying to grow aggressively.
Overpriced on free cash flow basis
The stock is trading high compared to its peers on a price to free cash flow basis. It is priced above the median for its sectors. Proceed with caution if you are considering to buy.
Add to Watchlists
loading..
Thank you for Sharing your Stock Targets for AVGO !
Loading...
Please login to proceed
Sorry - extended search is only available for registered users.